|
|
Monitoring a LightStream 2020 Switch
This chapter tells you how to determine the status of a LightStream 2020 multiservice ATM switch (LS2020 switch) and its components. It shows command examples and explains how you can obtain additional information about the LS2020 components and subsystems. It includes the procedures for using the CiscoView 2020 monitor, the LS2020 topology map, and the CLI.
Three tools are available for monitoring the LS2020 switch: the CiscoView 2020 monitor program, the LS2020 topology map, and the CLI. The LS2020 monitor and topology map programs are based on a graphical user interface (GUI); the CLI is not. In the monitor program, you click on components to display information about them. In the topology map program, you click on components to display a map that represents the actual topology of the LS2020 network. In the CLI, you use various attribute agruments of the show command to display the value of specified parameters. When you issue a show command, the switch retrieves the requested information from the MIB. You may see a collection of MIB attributes displayed or you may see only a single attribute.
You can monitor the following LS2020 components and subsystems:
For a description of trap monitoring, see the LightStream 2020 Traps Reference Manual.
Using the CiscoView 2020 Monitor
The CiscoView 2020 monitor is a GUI-based device management software application that provides dynamic status, statistics, and configuration information for the LS2020 switch. It is an SNMP-based management tool and displays a physical view of the switch. Although CiscoView is primarily a monitor application, you can use it to configure a small subset of chassis, card, and port parameters and perform minor troubleshooting tasks.
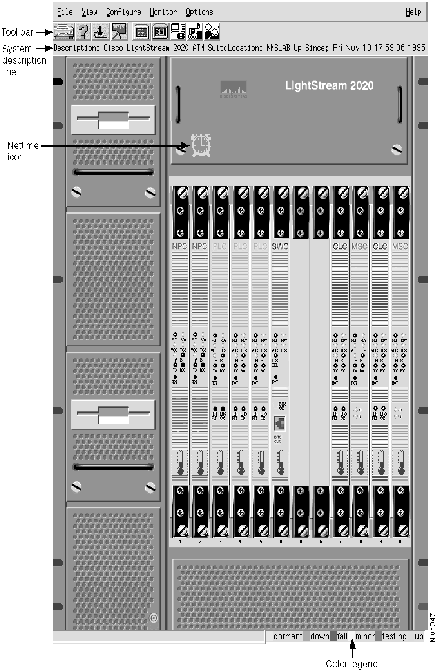
When you select the front view of the chassis, you see a physical representation of the line cards showing LED status, thermometer icons for each card, a Nettime color-coded icon, a system description line, and a color legend.
The display that results when you select a front view of the chassis is like the one shown in Figure 4-1. It shows the front view of the LS2020 chassis, its components, and their status. The name that appears at the top of the CiscoView 2020 monitor window reflects the name of the device you selected for monitoring. The front and rear displays are logical representations of the LS2020 chassis. They are not physical representations that you can modify.
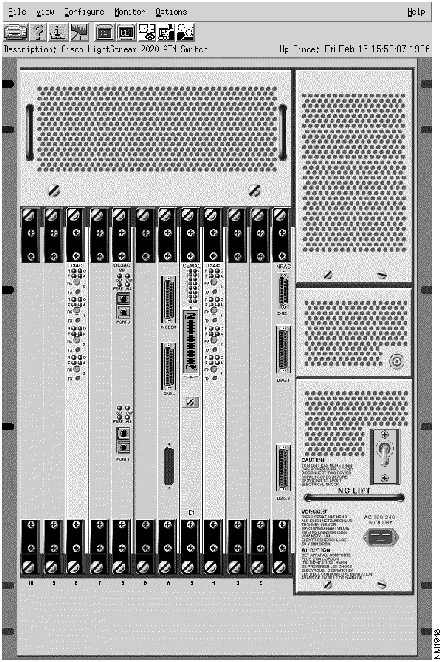
Figure 4-1 : Example of a Chassis Front View When you select the rear view of the chassis, you can identify an access card, select a port for configuration and monitor information, get color-coded port status, and check whether a card is operational. (If the corresponding front line card is not operational, the access card is displayed with no ports shown.) Figure 4-2 shows an example of a chassis rear view.
Figure 4-2 : Example of a Chassis Rear View
The expanded front and rear chassis views are the same as the front and rear chassis views, except that they eliminate the chassis display information and they magnify the front and rear cards. All monitor and configuration information for front cards, rear cards, and ports is identical to monitor and configuration information for expanded front cards, expanded rear cards, and expanded ports.
To select an option from the top menu bar on the monitor display (see Figure 4-1), follow these steps:
Table 4-1 lists the options on the monitor menu. Available options are highlighted.
Table 4-1 : Menu Bar Options on the Monitor Display
Using the Tool Bar and Menu Bar
The tool bar display (see Figure 4-3) provides quick access to monitoring and configuration information. It lets you print screen displays, access online help, and launch other applications. The tool bar display contains nine icons. When you click on one of these icons, the corresponding window is displayed:
In addition to using the tool bar, you can use the menu bar to invoke the same options.
Figure 4-3 : CiscoView 2020 Monitor Tool Bar Display
Configuring and Monitoring the Chassis
The CiscoView 2020 monitor application provides three levels of device configuration and device monitoring capability---chassis, front/read card, and port. You can access this information from the tool bar or from the menu bar.
The next sections describe the following:
Each section lists the items you can change or monitor. There is no prescribed order for the activities discussed in this secion. The order in which you perform these tasks depends on what you want to achieve.
The CiscoView 2020 monitor application lets you set some chassis, card, and port parameters. This section concentrates on chassis level parameters (also known as "device" level). You can set many, but not all, of the chassis parameters. The changes you make affect run-time memory only. If the chassis is reset, the changes are overwritten by the configuration parameter settings in the configuration database.
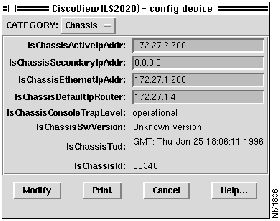
To invoke the Config Device window, first click on the chassis itself (anywhere in the logo area) and then either click on the third icon from the left on the tool bar (see Figure 4-3) or select the device option from the "Configure" menu. A Config Device window is displayed (see Figure 4-4).
Figure 4-4 : Config Device Window
When you click on the CATEGORY pushbutton in the upper left corner of the Config Device window, five options are listed:
When you select one of these options, the corresponding dialog box is displayed.
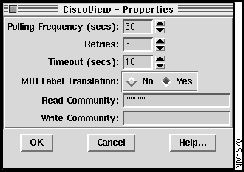
The fields represented by input boxes are configurable. However, before you attempt to change any of the configurable items, you need to change the Write Community field to the correct write community password string. If you do not change this field and try to modify an item, a "permission denied" message is displayed.
To change the Write Community field, follow these steps:
Figure 4-5 : Properties Window
The following paragraphs discuss the five options associated with the CATEGORY pushbutton--Chassis, Management, Physical, Nettime Switch Source, and Nettime Clocking Status.
Config Device Window -- Chassis
You can set the first four items in the Config Device window---Active IP address, secondary IP, Ethernet IP address, and default router IP address.
To use the Config Device:Chassis window to modify one of the chassis properties, follow these steps:
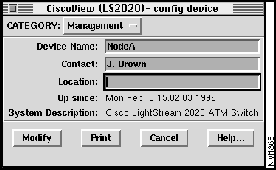
Config Device Window -- Management
You can set the first three items in the Config Device:Management window---Device Name, Contact, and Location.
To use the Config Device:Management window to modify one of the chassis properties, follow these steps:
Figure 4-6 : Config Device Window - Management
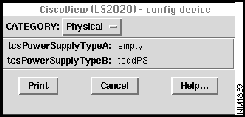
Config Device Window -- Physical
You see chassis physical information when you invoke the Config Device:Physical window. You cannot set any items in this window.
To display the Config Device:Physical window, click on the CATEGORY pushbutton and select the Physical option. The Config Device:Physical window is displayed (see Figure 4-7).
Figure 4-7 : Config Device Window - Physical
Config Device Window -- Nettime Switch Source
You can change the first item in the Config Device:Nettime Switch Source window---pushbutton.
To use the Config Device:Nettime Switch Source window to select one of the chassis properties, follow these steps:
Figure 4-8 : Config Device Window - Nettime Switch Source
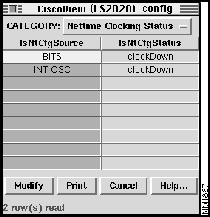
Config Device Window -- Nettime Clocking Status
You can set the items in the column labeled lsNtCfgSource in the Config Device:Nettime Clocking Status window.
To use the Config Device:Nettime Clocking Status window to modify existing entries, follow these steps:
Figure 4-9 : Config Device Window - Nettime Clocking Status
The Front Card Configuration dialog box includes information such as board type, LC software version, LCC software version, card name, and number of ports. For a given card, you may be able to obtain all or some of this information. Some of the card level configuration parameters can be changed.
To change card level configuation parameters, follow these steps:
Figure 4-10 : Example of Front Card Configuration Dialog Box
You can display several line cards at the same time. By selecting more than one card (by dragging the mouse across several cards on the front of the chassis and highlighting them), you can cause several cards to be displayed in one Configure dialog box.
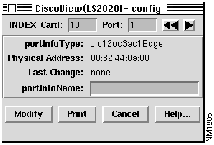
The Port Configuration dialog box includes fields with port type and name, physical address, and last change information (see Figure 4-11). Some of the port level configuration parameters can be changed (for example, the port name field).
Figure 4-11 : Example of Port Configuration Dialog Box
You can display information for several ports at the same time. By selecting more than one port (by dragging the mouse across several ports and highlighting them), you can cause information about several ports to be displayed in one Configure Port dialog box.
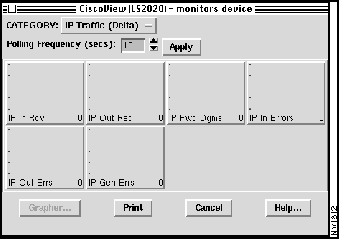
The CiscoView 2020 monitor lets you monitor chassis, card, and port information. You can change the polling frequency for all monitor parameters.
To invoke the Monitor Device window, first click on the device itself, and then either click on the fourth icon from the left on the tool bar or select the device option from the Monitor menu. A Monitor Device window is displayed (see Figure 4-12).
When you click on the CATEGORY pushbutton in the upper left corner of the Monitor Device window, five traffic categories are listed:
When you select one of these categories, the corresponding dialog box is displayed.
Figure 4-12 : Monitors Device Window
Changing the Polling Frequency
When you monitor chassis traffic, you can set the polling frequency only. The five traffic dialog boxes, which you can invoke from the Chassis Device Monitor window, are similar to one another. (The five dialog boxes correspond to the five traffic categories listed previously: IP, ICMP, TCP, UDP, and SNMP.) For that reason, this section presents one dialog box as an example---the IP Traffic dialog box.
To modify the IP traffic polling frequency, follow these steps:
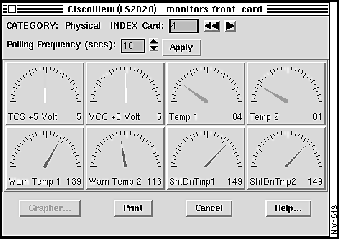
When you monitor a front card or rear card, you see card information, such as voltage and temperature readings. You cannot change the card level monitor parameters, but you can change the polling frequency for all card level monitor statistics. You can also traverse the line cards using the increment and rewind buttons (see Figure 4-13).
Figure 4-13 : Example of a Line Card Monitor Dialog Box
You can monitor several line cards or access cards at the same time. To display several cards in one monitor dialog box, drag the mouse across several cards to highlight them and click on the appropriate option from the Monitor pulldown menu.
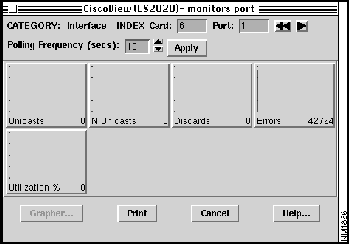
When you monitor a port, you see port information, such as number of errors, utilization percentages, and so on. The port level monitor parameters cannot be changed. However, you can change the polling frequency for all port level monitor statistics from each individual dialog box. You can also traverse the ports using the increment and rewind buttons (see Figure 4-14).
Figure 4-14 : Example of Port Monitor Dialog Box
You can monitor several ports at the same time. To display several ports in one monitor dialog box, drag the mouse across several ports to highlight them and click on the appropriate option from the Monitor pulldown menu.
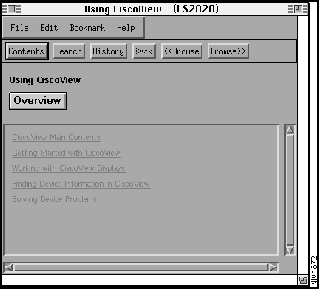
If you need help using the CiscoView 2020 monitor application, you can access online help by clicking on the second icon from the left on the tool bar icon or by selecting an option from the Help menu. If you select the icon from the tool bar icon, the Using CiscoView help window is displayed (see Figure 4-15).
Figure 4-15 : Example of Using CiscoView Help Window
If you select the Help pulldown menu, the following options are available (see Table 4-1):
The LS2020 topology map application displays a map that represents the actual topology of an LS2020 network. The map is a set of related objects, symbols, and submaps that provide a graphical and hierarchical presentation of the network.
The LS2020 topology map application runs on HP OpenView. If you are not familiar with the HP OpenView Windows product, see the HP OpenView User's Guide. When you start HP OpenView, the LS2020 Topology map application is automatically invoked. Once you start the application, it builds the current LS2020 submap and then periodically polls each LS2020 node for status information. When creating a new HP OpenView map, you can turn off the LS2020 topology function. You must have a color monitor to use the LS2020 topology map application.
The LS2020 topology map provides
Once the LS2020 submap is created, you can modify it by
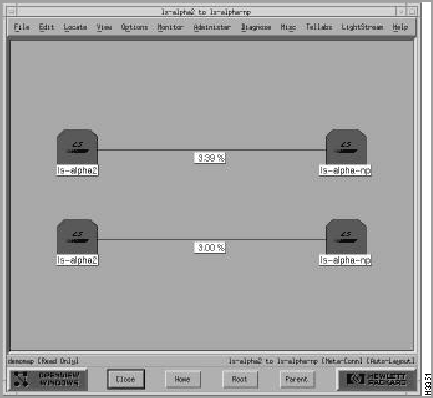
You can also show multiple trunk connections, which are represented by meta-connection symbols. The symbol for a meta-connection is <n>, where n is the number of connections being represented (see Figure 4-17).
As previously mentioned, once you start HP OpenView, it can create any number of maps, and each map is able to be configured to build an LS2020 topology. However, you do not view a map directly. You view the submaps that make up the map. A submap is a particular view of the network environment. Each submap displays a different view of your map. The application creates a Root submap for each LS2020 map. The Root submap provides a standard, top-level submap for every network map.
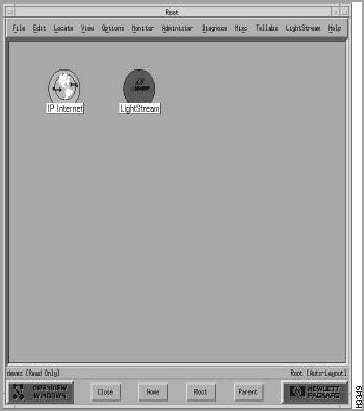
Figure 4-16 shows an example of a Root submap. In this figure, the Root submap contains two symbols: one that represents the Internet and another that represents an LS2020 network.
Figure 4-16 : Example of a Root Submap When you open a map, you actually view submaps of the map. To open the LS2020 submap, double-click on the LightStream symbol. Figure 4-17 shows a sample LS2020 topology submap.
In this example, the trunk between the ls-alpha2 and ls-alpha-np nodes actually represents two trunks, as indicated by the meta-connection symbol <2>.
Figure 4-17 : Example of an LS2020 Topology Submap When a meta-connection is first drawn, its symbol is not displayed. To display a meta-connection symbol (see Figure 4-18), follow these steps:
The next sections describe how to modify the LS2020 submap and view its meta-connection submap.
Figure 4-18 : Meta-connection Submap LightStream domains (logical groups of nodes) can consist of any number of LS2020 nodes. All trunk connections between selected nodes and nonselected nodes are redrawn between the LS2020 domain and the non-selected nodes. Any meta-connections between an LS2020 domain icon and either another LS2020 domain or a node show the two nodes that are connected. When you show an exploded view of an LS2020 domain icon, the nodes that make up the domain and any trunk connections between these nodes are displayed.
To create an LS2020 domain, follow these steps:
When you remove a domain from the topology map, the LS2020 nodes that were originally grouped in that domain are redrawn onto the current submap. To remove an LS2020 domain, follow these steps:
If you want to remove a node or connection from the LS2020 submap, follow these steps:
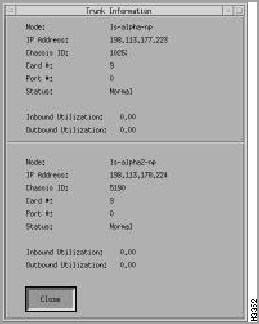
Within the LS2020 submap, a trunk connection is displayed including its interface bandwidth. If you want to get chassis, port, and utilization information about this connection, you click the left mouse button on a trunk. A pop-up dialog box appears and information similar to the following displays (see Figure 4-19).
Figure 4-19 : Example of a Trunk Connection The LS2020 Topology Manager periodically queries each LS2020 node for its trunk information to see if new trunks have been added or known trunks have been removed. It also communicates with HP OpenView for any new objects that are discovered. If new objects are found, the LS2020 Topology Manager (LTM) checks to see if the object's SysOid number matches its own.
Changing LS2020 Topology Map Attributes
The LS2020 submap attributes that you can modify are
The next sections provide a brief description of the attributes and the steps for changing them.
Procedure to Change the LS2020 Topology Map Attributes
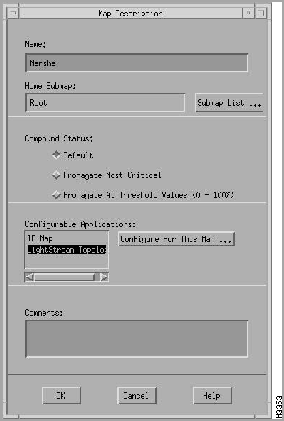
You can modify these attributes from either the OpenView Root dialog box or the LS2020 Submap dialog box:
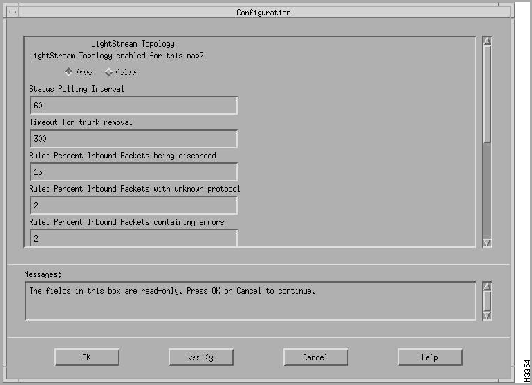
Figure 4-20 : Example of Map Description Dialog Box Figure 4-21 : Example of Configuration Dialog Box From the Configuration box, you can enable or disable the LS2020 Topology Manager (LTM) and select the attributes that you want to modify, such as status polling interval, timeout for trunk removal, and so on.
The default is to enable the LS2020 Topology Manager (LTM) when you start HP OpenView.
The LS2020 topology map application polls each LS2020 node periodically for status information (the default polling time is 60 seconds).
Status changes in the network are displayed through changing colors on the network map and writing messages to HP OpenView Alert window.
Table 4-2 lists the possible status conditions of a node in the network and their meanings. Table 4-3 lists the same information for a trunk connection in the network.
Table 4-2 : Node Status Definitions
Table 4-3 : Trunk Connection Status Definitions
The default for the timeout for trunk removal attribute is 300 seconds.
The LS2020 topology map application collects information for each interface to determine the condition of the LS2020 network. There are rule definitions that apply to the data collected. For example, the default value for the percent inbound packets being discarded is 15 percent. If the percent of packets being discarded exceeds either the default value or the value you set, a message gets logged to the HP OpenView Alert window. You can change the rate of the default value according to your network needs. Table 4-4 lists the rules and their default values that are applied to the data collected.
Marginal status indications for nodes and major status indications for connections indicate potential network integrity problems. Once a problem is discovered, such as a large number of packets being discarded, the appropriate status is set. The status remains in effect until a time period (the default is 5 minutes) elapses without the problem being discovered. To change the default, select the File...Describe/Modify menu item.
Using the CLI to Monitor Hardware Components
This section provides the steps for monitoring the hardware components of an LS2020 switch:
To monitor the chassis, follow these steps. The information that displays applies to the LS2020 switch.
If you need instructions on changing the target switch, see the section on "Setting the Target Switch for CLI Commands" in the chapter entitled "Command Line Interface."
The following example shows what information displays when you enter show chassis all.
If you enter any parameter except all, a subset of the show chassis command is displayed. For example, if you enter the command show chassis agent, information similar to the following is displayed:
You can monitor network processor (NP) cards, edge cards, trunk cards, and switch cards. You select the card you want to monitor by specifying its card number (slot number).To determine a card's slot number, you can look at the front of the system to see the numbered slots (see Figure 4-1). When you specify a card, you also get information on its associated access card. To monitor the cards in the LS2020 switch, follow these steps.
When you enter show card 5 all, information similar to the following (for a medium-speed card) is displayed:
These steps allows you to monitor the ports on a particular card. You can look at information for a single port, a collection of ports, or a range of ports.
The following text shows an example of the display you see when you enter show port 8.0 all for an OC3 edge port.
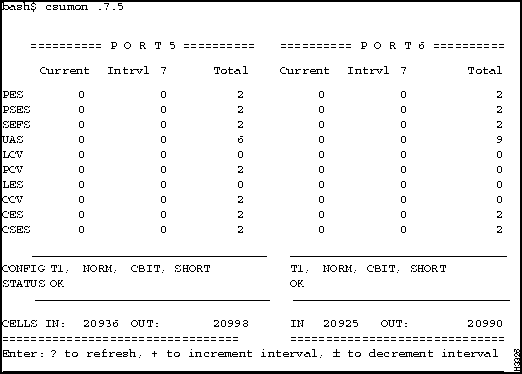
The csumon tool, available from the bash shell, lets you monitor the DSU/CSU for the following:
In addition, you can use csumon to issue commands to an external DSU/CSU attached to a low-speed interface.
Monitoring the DSU/CSU on a Low-Speed Line Card
You can obtain CSU statistics by connecting to an external data service unit/channel service unit (DSU/CSU) from an LS2020 switch through a serial line. This provides a terminal to the DSU/CSU. You use its own interface to set up and monitor the DSU/CSU. (See the documentation for the DSU/CSU for details.)
Figure 4-22 : Example Showing csumon Display for a Low-Speed Line Card Monitoring the DSU/CSU on a Medium-Speed Line Card
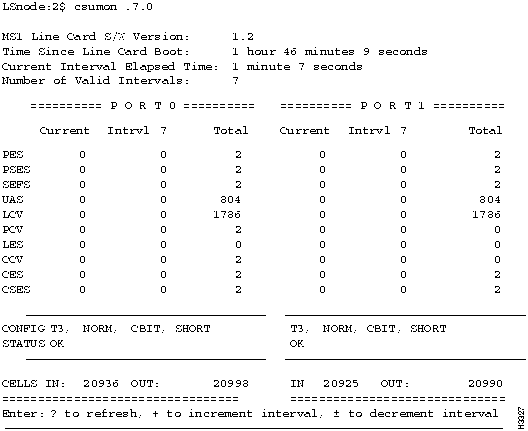
The medium-speed line card (MSC) has a built-in DSU/CSU. Use the following steps to monitor and display the DS3 MIB statistics for MSC ports. MSC CSU statistics are available through use of the standard DS3 MIB variables.
Figure 4-23 : Example Showing csumon Display for a Medium-Speed Line Card
To monitor the modem port on the switch card's console/modem assembly, follow these steps:
Table 4-5 : csumon Display Term Definitions
Table 4-6 : csumon Status Term Definitions
Monitoring Switch Cards, NPs, and Power Supplies
These steps tell you how to monitor the status of your redundant components (switch cards, NPs, and power supplies):
This command displays the status and type of the two power supplies, A and B.
The following example shows the output for the three commands previously described.
Using the CLI to Monitor Configuration and Status
This section provides steps for monitoring the configuration and status of the following connections and processes of an LS2020 switch:
The ATM connections include:
To monitor the ATM UNI permanent virtual connection (PVC) configured on a particular ATM UNI port, follow these steps. They provide you with information on the individual connections configured on each port. This information is available for ATM UNI ports only.
The following text is an example of the display you see when you enter show port 8.0 vci 1000.
You can also get a list of all the ATM UNI VCIs for the entire chassis by entering the show chassis listvci command.
To monitor the ATM UNI permanent virtual path (PVP) configured on a particular ATM UNI port, follow these steps. They provide you with information on the individual connections configured on each port. This information is available for ATM UNI ports only.
The following text is an example of the display you see when you enter show port 8.0 vpi 50.
You can also get a list of all the PVPs for the entire chassis by entering the show chassis listvpi command.
Monitoring Frame Relay Connections
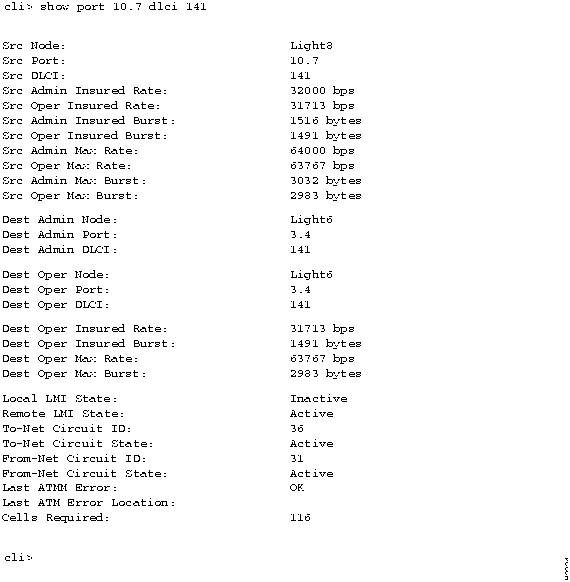
These steps allow you to monitor individual data link connections configured on Frame Relay ports. These connections are recognized by their data link connection identifiers (DLCIs).
Figure 4-24 shows an example of the display you see when you enter show port 10.7 dlci 141.
Figure 4-24 : Example Showing the show port 10.7 dlci 141 Display You can also get a list of all the Frame Relay connections for the entire chassis by entering the show chassis listdlci command.
Monitoring CLI Attribute Settings
These steps let you monitor the attribute settings for the CLI program itself:
The collector lets you run up to 25 collections at one time. You can set up the collections to save user-defined data for a specified time interval and you can use this data for future analysis. For further information on creating collections, see the "LightStream 2020 Statistics and Data Collection" chapter.
To monitor the status of a particular collection, follow these steps:
The global information distribution (GID) system is a service that maintains a consistent network-wide database. It ensures that every switch has an up-to-date copy of all the information in the database.
To monitor the status of the GID software, follow these steps:
The following is an example of the display you see when you enter show gid all:
If you enter any parameter except all, a subset of the attributes is displayed.
The neighborhood discovery (ND) process runs on every NP in an LS2020 network. It collects information about the local topology of the network, keeps track of the interface modules that are added to or removed from service, and determines which NP controls each interface module.
To monitor the status of the ND software, follow these steps:
The following is an example of the display you see when you enter show nd all:
If you enter any parameter except all, a subset of the attributes shown above is displayed.
These steps let you monitor the status of a particular process. You select the process you want to monitor by entering its number or name.
The following is an example of the display you see when you enter walksnmp pidName:
The following is an example of the display you see when you enter show pid 9 all:
The same information displays when you enter show pid lcc9. (The lcc9 entry is the alias name for process 9.)
If you enter any parameter except all, a subset of these attributes displays.
SNMP operation is controlled by a number of parameters that are set to default values when the system is started. These parameters can be changed through use of the set snmp command. (See the "SNMP Commands" chapter for a discussion of this command.)
To monitor SNMP parameters, enter the show snmp command at the Monitoring the Test and Control System
The test and control system (TCS) is a fully integrated, yet autonomous, computer system with the LS2020 chassis. There is a TCS microcomputer on each NP, interface, and switch module in an LS2020 chassis. The TCS has a separate communications path from the LS2020 switch.
The main functions of the TCS are to manage low-level operations of each module and to provide access to all modules in the chassis through a local console port, which is supported by the TCS microcomputer on the switch card.
To monitor the values collected by the TCS on a particular card in the chassis, follow these steps. The cards you can monitor are in slots 1 --- 10, switch A (SA), and switch B (SB).
Table 4-7 describes <parameter1> and <parameter2>.
Table 4-7 : Parameter Options---show tcs Command
When you enter show tcs 1 all, information similar to the following is displayed. If you use any value except all for the argument, a subset of this information is displayed.
Copyright 1988-1996 © Cisco Systems Inc.
/usr/LightStream-xxx
, where
xxx
is the release number. For example,
/usr/LightStream-2.2.1
.
/usr/OV/bin/ls_bin
.
/usr/LightStream-xxx/bin
where
xxx
is the release number. For example,
/usr/LightStream-2.2.1
/bin
.
/usr/OV/bin/ls_bin/bin
/usr/OV/bin
.
%
nmcview -host <hostname>
This menu...
Includes an option...
To let you...
File
Open Device
Access the switch you want to configure or monitor and set a read/write community.
Open Previous
Access a switch you previously opened.
Print
Print screen capture.
Print Setup
Choose your print options.
Exit
Exit the monitor application.
View
Refresh
Refresh current view.
50%
Reduce the chassis view by 50% (toggles between 50% and 100%).
front
Display the front components of a chassis.
rear
Display the rear components of a chassis.
expanded_front
Display a magnified version of the front cards.1
expanded_rear
Display a magnified version of the rear cards.2
Configure
device
Invoke a device window to view chassis information or to change a chassis parameter (see the section on "Configuring a Chassis").
front_card
expanded_front_card
Invoke an expanded front window to view front card information or to change a front card parameter (see the section on "Configuring a Chassis").
port
expanded_port
Invoke a port window to view port information or to change a port parameter (see the section on "Configuring a Chassis").
Monitor
device
Invoke a monitor device window to display chassis information.
front_card
expanded_front_card
Invoke a front card window to display line card information.
port
expanded_port
Invoke a port window to display port information.
rear_card
expanded_rear_card
Invoke a rear window to display access card information.
Options
Show Tool Bar
Display tool bar icon.
Show Legend
Display color bar legend.
Show System Info
Display system information, such as chassis description, location, and up time.
Properties
Invoke Properties window to modify community name and to modify the SNMP information fields (such as polling frequency, timeout, and so on).
Help
Contents
Invoke the "Managing Devices with CiscoView" help window.
Using Help
Invoke the "How to Use Help window," which describes hyperhelp basics and lists help topics.
Using CiscoView
Invoke the "Using CiscoView" help window, which lists features, explains how to navigate through the CiscoView application, and describes component dialog boxes.
About CiscoView
Invokes a popup dialog box, which contains the CiscoView software version and copyright information.
1 On the CiscoView 2020 menu bar, the term "front card" refers to what is elsewhere called the "line card."
2 On the CiscoView 2020 menu bar, the term "rear card" refers to what is elsewhere called the "access card."




Status
Meaning
Unknown
Unable to access the node through SNMP.
Critical
One of the following problems has been detected: a chassis ID conflict, a bad power supply, abnormal temperature, or a diagnostic error on a card.
Major
One or more cards within the node reported a down operational status.
Marginal
One of the following problems on an edge port has been detected: congestion, high error rate, large amount of discarded traffic, or attempt to use an improperly configured PVC. If any of these problems is detected, a message appears in the HP OpenView Events window. Note that for Release 2.1 edge port monitoring is turned off.
Normal
No known problems detected.
Unmanaged
The user has configured the node to be unmanaged.
Status
Meaning
Unknown
Unable to get port information through SNMP.
Critical
The ifOperStatus reported down for either port in the connection, or the trunk is no longer being discovered in the GID table.
Major
One of the following problems on either of the ports on the trunk connection has been detected: high number of packets being discarded, high trunk utilization, high error rate, or attempt to use an improperly configured PVC. If any of these problems are detected, a message appears in the HP OpenView Events window.
Warning
One of the following problems on either of the ports on the trunk connection has been detected: high number of packets with unknown protocols being received or the output queue length is excessively high.
Normal
No known problems detected.
Unmanaged
The user has configured the trunk to be unmanaged.
Testing
The ifOperStatus reported testing for either port in the connection.
Rule
Default Value
Percent inbound packets being discarded
15%
Percent inbound packets with unknown protocol
2%
Percent inbound packets containing errors
2%
Percent outbound packets being discarded
15%
Percent outbound packets containing errors
2%
High output queue length
10
cli>
prompt:
cli> show snmp
cli>
prompt:
cli> show chassis <parameter>
general
agent
congestion
primaryswitch
powersupply
cards
listff
listdlci
listvci
listvpi
listtrunk
listpvc
atm-netprefix
atm-default-port
lecs-address
Name:                     node_A
Description:              Cisco LightStream 2020 ATM Switch
Contact:                  Rick Bell
Location:                 Saturn
System Up Time            95 Hr 12 Min 47 Sec

Software Version:         2.
Console Trap Level:       Oper
Chassis ID:               5143
Slot of Primary NP:       1
Slot of This NP:          1

Primary Addr:             196.113.179.15
Secondary Addr:           0.0.0.0
Subnet Mask:              255.255.255.0
Ethernet Address:         196.113.178.15
Ethernet IP Mask:         255.255.255.0
Default Router:           196.113.178.1

MMA Trap Filter Level:    Oper
MMA Trap Logging State:   On
MMA Collection Size:      32 KB
Config DB Active:         On

MMA PID:                  56
Configuration Host:
Configuration Author:
Configuration ID:         2

Maximum Interval between Permit Limit Updates:     5000 ms.
Minimum Interval between Permit Limit Updates:     1000 ms.
Minimum Interval between CA Updates:               1000 ms.


Primary Switch:                 Switch A, Synchronized
Secondary Switch Users:         None
Secondary Switch Clock Faults:  None
Power Supply A:           Empty
Power Supply A Type:      Empty
Power Supply B:           Good
Power Supply B Type:      1200W AC Power Supply

Slot 1:  NP
Slot 2:  OC3 Trunk
Slot 3:  OC3 Edge
Slot 4:  T3 Trunk
Slot 5:  T3 Edge
Slot 6:  MS Trunk
Slot 7:  Serial Edge

Slot 8:  OC3 Trunk
Slot 9:  FDDI
Slot 10: Ethernet
Slot SA: Switch2
Slot SB: Empty
This chassis has no Frame Forwarding connections
This chassis has no Frame-Relay DLCIs
This chassis has no ATM-UNI VCIs
This chassis has no ATM-UNI VPIs
Trunk list:
-----------
S Local stat Remote Raw BW Data BW Ctrl BW
- ----- ---- ------ ------ ------- -------
lstb5:2.0 -> lstb4:8.0 353208 349675 3532
lstb5:2.0 <- lstb4:8.0 353000 349470 3530
lstb5:4.0 -> lstb6:10.0 96000 93120 2876
lstb5:4.0 <- lstb6:10.0 96000 83810 2876
lstb5:4.1 -> lstb6:10.1 96000 83810 2820
lstb5:4.1 <- lstb6:10.1 96000 93120 2844
lstb5:4.2 -> lstb6:10.2 96000 93120 2872
lstb5:4.2 <- lstb6:10.2 96000 93120 2880
lstb5:4.3 -> lstb7:5.1 96000 86402 2844
lstb5:4.3 <- lstb7:5.1 96000 86402 2832
lstb5:8.0 -> lstb3:5.0 353208 333647 3464
lstb5:8.0 <- lstb3:5.0 353208 333647 3436
This chassis has no CBR PVCs
cli>
cli> show chassis agent
MMA Trap filter Level:            Oper
MMA Trap Logging State:           On
MMA Collection Size:              32 KB
Config DB Active:                 On
MMA PID:                          11
Configuration Host:               boston
Configuration Author:             Bob Williams
Configuration ID:                 26
cli>
cli>
prompt:
cli>
show snmp
cli>
prompt:
cli>
show card <card#> <parameter>
1 --- 2 for NP cards
2 --- 10 for line cards
switcha or switchb for switch cards
name (no information available for switch cards)
processid
status
version
peak-cell-rate
hardware
ports (no information available for NP or switch cards)
cli> show card 5 all
Card Name:              emtb7.5_ms-t
Card PID:               31
Operational Status:     Up
Administrative Status:  Up
Configuration Register: Up

Maximum Number of VCs: 800

LC Software Version:    Version: 1.3.20.1 Compiled cp_ms1.aout: compiled Oct 16 1995 @
09:51:16
LCC Software Version:   LCC (Version 1.000 of Oct 16 1995)

Card Type:                MS Trunk
Top Temperature:          72 F (22 C)
Bottom Temperature:       70 F (21 C)
TCS Voltage:              4.931 volts
VCC Voltage:              4.980 volts
VEE Voltage:              2.499 volts
Access Card Region 1 Temperature: 68 F (20 C)
Access Card Region 2 Temperature: 71 F (21 C)


Port   Protocol          Name                        Admin Stat     Oper Stat
----   --------          ----                        ----------     ---------
5.0    MS Trunk          tb7.5.0-tr-t                   Up            Up
5.1    MS Trunk          tb7.5.1-tr-t                   Up            Up
cli>
cli>
prompt:
cli>
show snmp
cli>
prompt:
cli> show port <c.p> <parameter1> <parameter2>
all (default)
name
status
statistics
physical
frameforward
framerelay
vp-switching
listdlci
listpvc
listvci
listvpi
dlci
cbrpvc
vci
vpt-vpi
vpi
fddi
datarate
wgrp
bflt
ipflt
ipxflt
np-deliver
sonet
stb
uni
ilmi-uni
signalling-uni
atm-esi
atm-netprefix
local-atm-address
extern-atm-address
bflt-def
ipflt-def
ipxflt-def
bcast-limit
cli> show port 8.0 all
Description:              CLC1 OC3 Edge Line Card Rev 1.0
Port Name:                lstb3.8.0
Port Type:                OC3 Edge
MIB2 Type:                sonet
OC3 Medium Type:          Sonet (STS-3c)
Port MTU:                 53 Octets
Port Speed:               155520000 bps

Admin Status:             Up
Oper Status:              Down
Transmit safety:          Disabled
Oper loop:                No Loop
Admin loop:               No Loop
Last Oper Change:         281 Hr 38 Min 30 Sec ago

Octets Rcvd:              0          (Delta: 0          Rate: 0.00/sec)
Normal Cells Rcvd:        0          (Delta: 0          Rate: 0.00/sec)
Multicast Cells Rcvd:     0          (Delta: 0          Rate: 0.00/sec)
Discarded Rcvd Cells:     0          (Delta: 0          Rate: 0.00/sec)
Output Errors:            561

Oper Protocol:                 ATM-UNI
Admin Protocol:                ATM-UNI
Port Data Cell Capacity:       353208 cells
Port Available Capacity:       349393 cells
Link Transmit Utilization:     4 cells/sec.
Clocking:                      internal
Cell Payload Scrambling:       Enabled (read only)
VP Switching:                  Enabled

This port has no VCIs

This port has no VPIs

Medium
        Time Elapsed in current interval:   263
        Number of valid interval(s):        73
Section
        Status:                             <Loss of signal><Loss of frame>
        Error seconds:                      263
        Severe error seconds:               263
        Severe framing error seconds:       263
        Coding violations:                  10154001
Line
        Status:                             <AIS>
        Error seconds:                      0
        Severe error seconds:               0
        Unavailable seconds:                441
        Coding violations:                  0
Path
        Path width:                         sts3cSTM1
        Status:                             <STSLOP><STSAIS><STSRDI>
        Error seconds:                      0
        Severe error seconds:               0
        Unavailable seconds:                441
        Coding violations:                  0


ATM Interface Configuration:
Class:                    private
Role:                     network
Type:                     uni3-0
ILMI status:              enable
Signalling status:        enable

Number of active VPI bits 0
Number of active VCI bits 15

ILMI Configuration:
State:                    starting
VCI:                      16

Signalling Layer Configuration:
Signalling VCI:           5
Minimum VCI value:        48
Maximum VCI value:        32767
Minimum VPI value:        0
Maximum VPI value:        0
Address format:           both
Routing on subaddress:    yes
Maximum signalling rate:  14129 cells/sec
SSCOP state:              state -1: disabled

This port has no ESI data base configured


This port has no Network Prefix data base configured

This port has no Local ATM Address data base configured


This port has no External ATM Address data base configured

cli>
LSnode:#
csumon <.card.port#>
LSnode:1#
csumon
LSnode:1#
csumon <.card.port#>
cli>
prompt:
cli>
show snmp
cli>
prompt:
cli>
show modem <slot#> <parameter>
initstring
cli>
show modem sa all
Initstring: AT&S&D2&&C1SO=1S7=3OS36=7S95=44
cli>
Counter1
Definition
PES
P-bit Errored Seconds
PSES
P-bit Severely Errored Seconds
SEFS
Severely Errored Framing Seconds
UAS
UnAvailable Seconds
LCV
Line Coding Violations
PCV
P-bit Coding Violations
LES
Line Error Seconds
CCV
C-bit Coding Violations
CES
C-bit Errored Seconds
CSES
C1-bit Severely Errored Seconds
1 See RFC 1407 for a further description of these counters.
Status Term
Definition
OK
No alarms present
RED
Loss of Framing
YELLOW
Far End Receive Failure
BLUE
Receiving an Alarm Indication Signal
LSnode:1#
csumon
cli>
prompt:
cli>
show snmp
cli>
prompt:
cli>
show chassis primaryswitch
cli>
prompt:
cli>
show chassis general
cli>
prompt:
cli>
show chassis powersupply
cli>  show chassis primaryswitch
Switch:                   Switch A


cli> show chassis general
Name:                     lstb8
Description:              Cisco LightStream 2020 ATM Switch
Contact:                  Jones
Location:                 Venus
System Up Time            121 Hr 14 Min 3 Sec

Software Version:         2.1.1
Console Trap Level:       Info
Chassis ID:               5142
Slot of Primary NP:       1
Slot of This NP:          1

Primary Addr:             196.113.179.18
Secondary Addr:           196.113.179.28
Subnet Mask:              255.255.255.0
Ethernet Address:         196.113.178.18
Ethernet IP Mask:         255.255.255.0
Default Router:           196.113.178.1


cli> show chassis powersupply
Power Supply A:           Empty
Power Supply A Type:      Empty
Power Supply B:           Good
Power Supply B Type:      1200W AC Power Supply

cli>
cli>
prompt:
cli>
show snmp
cli>
prompt:
cli>
show port <c.p> listvci
cli>
prompt:
cli>
show port <c.p> vci <vci#>
cli>
show port 8.0 vci 1000
Source Node: lstb3
Source Port: 8.0
Source VCI: 1000
Src Admin Insured Rate: 12000 cells/sec
Src Oper Insured Rate: 12000 cells/sec
Src Admin Insured Burst: 300 cells
Src Oper Insured Burst: 300 cells
Src Admin Max Rate: 13000 cells/sec
Src Oper Max Rate: 13000 cells/sec
Src Admin Max Burst: 600 cells
Src Oper Max Burst: 600 cells
Dest Oper Node: lstb5
Dest Oper Port: 3.0
Dest Oper VCI: 1000
Dest Oper Insured Rate: 12000 cells/sec
Dest Oper Insured Burst: 300 cells
Dest Oper Max Rate: 13000 cells/sec
Dest Oper Max Burst: 600 cells
Oper Prin Service Type: guaranteed
Admin Prin Service Type: guaranteed
Oper Transmit Priority: 1
Admin Transmit Priority: 1
To-Net Circuit ID: 1000
To-Net Circuit State: Active
From-Net Circuit ID 1000
From-Net Circuit State: Active
Last ATMM/Appl. Error: ATMM error 0: OK
Cells Required: 12020
CLP=0 Cells to Switch: 0
CLP=0/1 Cells to Switch: 0
CLP=1 Cells to Switch: 0
Discarded Cells: 0
cli>
cli>
prompt:
cli>
show snmp
cli>
prompt:
cli>
show port <c.p> listvpi
cli>
prompt:
cli>
show port <c.p> vpi <vpi#>
show port 8.0 vpi 50
Source Node: lstb3
Source Port: 8.0
Source VPI: 50
Src Admin Insured Rate: 34000 cells/sec
Src Oper Insured Rate: 34000 cells/sec
Src Admin Insured Burst: 600 cells
Src Oper Insured Burst: 600 cells
Src Admin Max Rate: 34800 cells/sec
Src Oper Max Rate: 34800 cells/sec
Src Admin Max Burst: 1023 cells
Src Oper Max Burst: 1023 cells
Dest Oper Node: lstb5
Dest Oper Port: 3.0
Dest Oper VPI: 50
Dest Oper Insured Rate: 0 cells/sec
Dest Oper Insured Burst: 0 cells
Dest Oper Max Rate: 0 cells/sec
Dest Oper Max Burst: 0 cells
Oper Prin Service Type: guaranteed
Admin Prin Service Type: guaranteed
Oper Transmit Priority: 1
Admin Transmit Priority: 1
To-Net Circuit ID: 0
To-Net Circuit State: Inactive
From-Net Circuit ID 0
From-Net Circuit State: Inactive
Last ATMM/Appl. Error: ATMM error 53: Unexpected LCM error
Last ATM Error Location: lstb5:3.0
Cells Required: 34016
CLP=0 Cells to Switch: 0
CLP=0/1 Cells to Switch: 0
CLP=1 Cells to Switch: 0
Discarded Cells: 0
cli>
cli>
prompt:
cli>
show snmp
cli>
prompt:
cli>
show port <c.p> listdlci
cli>
prompt:
cli>
show port <c.p> dlci <dlci#>
cli>
prompt:
cli>
show cli <parameter>
echosource
lineedit
log
term
timer
timestamp
timeout
traplevel
debug
banner
Echo source:  on

Line Edit:  on

Logging:  off

Terminal Type:  vt100

Date/Time:  Thu Jun 15 16:02:40 1995

SNMP Timeout value=  6 seconds

Timestamp:  off

Timer:  4 Hour(s) 37 Minute(s)  38 seconds

Traplevel:  Debug

Debug:  off

Banner:  CLI (Version 2.100 of May 24 1995

PROGRAM: cli:  compiled May 24 1995 @ 02:31:40
cli>
prompt:
cli>
show snmp
cli>
prompt:
cli>
show collection [<collection #>]
*cli>
show collection 1
*** Collection 1 ***
Collection Status: Under Creation
Operational Status: Under Creation
Begin Time: 06/22/1995 08:02:43 EDT (06/22/1995 12:02:43 GMT)
End Time: 01/18/2038 22:14:07 EST (01/19/2038 03:14:07 GMT)
Interval: 60 sec
File: /usr/tmp/collector/collect.1
Collection Items:
Name: CollectDBObjectID.1.1 Value: ifInOctets.3000
Name: CollectDBObjectID.1.2 Value: ifInOctets.3001
Name: CollectDBObjectID.1.3 Value: ifInOctets.3002
Name: CollectDBObjectID.1.4 Value: ifInOctets.3003
cli>
prompt:
cli>
show snmp
cli>
prompt:
cli>
show gid <parameter>
general
synchronization
cards
clients
neighbors
ports
ip
cli> show gid all

Software Version Number:        gidd: (ls2_1_1) compiled Oct 16 1995 @ 01:52:23
GID Process ID (PID):           76
Memory In Use:                  0 Bytes
Memory Allocation Failures:     0

Neighbors in Existent Sync State:       0
Neighbors in Exchange Start State:      0

Neighbors in Exchange State:            0
Neighbors in Loading Sync State:        0
Neighbors in Full Sync State:           3

                   Cards Managed by Gid:
                   ---------------------

 Chassis    Slot      Seq#    Age  Originating-NP  Ports
 -------    ----      ----    ---  --------------  -----
lstb8         1   139863522    543       lstb8.1      0
lstb8         2   141243346   1327       lstb8.2      0
lstb8         3   139863833   1439       lstb8.1      8

.

.

.

                   Clients Managed by Gid:
                   -----------------------

Client PID    LSA-Rx    IPA-Rx    Gen-Rx Events-Tx Paths-Generated
------ ---    ------    ------    ------ --------- ---------------
   69           0         0         0         0           0
   70           0         0         0         0           0
   77      1316353       243       163       519        6257
   .

   .

   .

                  Neighbors Managed by Gid:
                  -------------------------
 Chassis     VCI    State    SYNC RLL  SLL Hello  LSA  NLSA   IPA NIPA   GA  NGA
 -------     ---    -----    ---- ---  --- -----  ---  ----   --- ----   --  ---
 lstb8.2   62722  full        8   0    0    2   196   196   131  131    5    4
 lstb7.1   79105  full        7   0    0    2  6212  5876   381  366   62   62

 .

 .

 .


                       Ports Managed by Gid:
                       ---------------------

 Chassis     Port Service Up/Down      BW0       BW1       BW2    Remote-Port
 -------     ---- ------- -------      ---       ---       ---    -----------
 lstb8         3.0   edge      Up       188       188         0        none.none
 lstb8         3.1   edge    Down         0         0         0        none.none
 lstb8         3.2   edge      Up      2628      1298         0        none.none

 .

 .

 .

                   IP Addresses Managed by GID:
                   ----------------------------

 IP Address       Age    Seq#   Advertising-NP    Net-Mask          Port
 ----------       ---    ----   --------------    --------          ----
196.113.178.13   2430  146596901    lstb3.1    255.255.255.0        lstb3.0.11
196.113.178.14   2059  146605717    lstb4.1    255.255.255.0        lstb4.0.11
196.113.178.15   2154  146603365    lstb5.1    255.255.255.0        lstb5.0.11
.

.

.
cli>
cli>
prompt:
cli>
show snmp
cli>
prompt:
cli>
show nd <parameter>
general
ndcards
neighbors
switchupdown
switchstat
client
cli> show nd all
Software Version Number:             ndd: (ls2_1_1) compiled Oct 16 1995 @ 02
ND Process ID (PID):                 49
Memory In Use:                       347686 Bytes
Timers Processed:                    1456263
Number of Line Cards managed by ND:  7
Neighbor NPs known to ND:            4
Registered ND Client Processes:      16

Cards Managed by ND:
EIA: lstb8.3    Channel: 26115   State: Up
EIA: lstb8.4    Channel: 9988    State: Up
EIA: lstb8.5    Channel: 5637    State: Up

.

.

.

ND Neighbor Information
EIA: lstb8.1          Channel:     34049 State: Up
EIA: lstb8.2          Channel:     62722 State: Up

.

.

.


ND Up/Down Parameters:
Slot:  1 Oper Intvl: 900   J: 2     K: 31    M: 2     N: 32
         Admn Intvl: 900   J: 2     K: 31    M: 2     N: 32
Slot:  2 Oper Intvl: 900   J: 2     K: 31    M: 2     N: 32
         Admn Intvl: 900   J: 2     K: 31    M: 2     N: 32
Slot:  3 Oper Intvl: 900   J: 2     K: 31    M: 2     N: 32

         Admn Intvl: 900   J: 2     K: 31    M: 2     N: 32

.

.

.


ND Switch Statistics:
Slot:  1  In Cells:    485589  Errs:         0  Out Cells:    485589  Errs: 0
Slot:  2  In Cells:    486066  Errs:         0  Out Cells:    485688  Errs: 0
Slot:  3  In Cells:    484356  Errs:         0  Out Cells:    485689  Errs: 0

.

.

.


ND Clients:
PID:  56        Type: sys       Subtype:    5 EIA: 0.0             Mask: 0x0
PID:  68        Type: Unknown   Subtype:   11 EIA: 0.0             Mask: 0x200
PID:  69        Type: Unknown   Subtype:    9 EIA: 0.0             Mask: 0x230

.

.

.
cli>
cli>
prompt:
cli>
show snmp
cli>
prompt:
cli>
walksnmp pidName
cli> walksnmp pidName
Name: pidName.49 Value: ndd
Name: pidName.54 Value: lcmon
Name: pidName.55 Value: trapmon
Name: pidName.56 Value: watchdog
Name: pidName.57 Value: mma
Name: pidName.68 Value: sysinit
.

.

.
cli>
cli>
prompt:
cli>
show pid {<#>|<alias>} [<parameter>]
name
clialias
createtime
adminstatus
operstatus
traplevel
cli> show pid 71 all
PID Name:                       rmon
PID Alias:                      RMON
PID Up Time:                    121 Hr 43 Min 25 Sec
PID Administrative Status:      Active
PID Operation Status:           Active
PID Trap Level:                 Info
cli>
cli>
prompt. The following is an example of the display you see when you enter show snmp:
cli> show snmp

Community: public
HostName:  localhost
cli>
cli>
prompt:
cli>
show snmp
cli>
prompt:
cli>
show tcs <card #> [<parameter1>] [<parameter2>]
2 --- 10 for line cards
SA and SB for switch cards
<parameter1> =
<parameter2>1 =
all (default)
N/A
state
N/A
config
all
assembly
postcode
serialnum
slavecode
type
daughter
all
assembly
serialnum
paddle
all
assembly
serialnum
oem
all
assembly
serialnum
midplane
all
assembly
serialnum
nodeaddress
temperature
N/A
voltage
N/A
power
N/A
1 Parameter2 is dependent on parameter1. When you enter a command, you first select the value of parameter1 from this table. Based on that selection, you can choose a value of parameter2 that is associated with parameter1.
cli> show tcs 1 all
Slot  1 State:
        Power Supply:           OK
        Temperature:            OK
        Clock:                  OK
        POST:                   OK
        XILINX Load:            OK
        Application Load:       OK
        Paddle Card:            PRESENT
        Paddle Card:            OK
        Paddle Card Override:   DISABLED
        Paddle Power Override:  DISABLED
        Flash:                  ENABLED
        CP POST:                ENABLED
        Application:            ENABLED
        Card:                   ENABLED
        TCS VCC Power:          OK
        VCC Power:              OK

        VPP Power:              OK
        SCSI Power:             OK
        Top Temperature:        OK
        Bottom Temperature:     OK
        Board Initialization:   OK
        Flash Initialization:   OK
        TCS HUB:                OK
Slot  1 Config Assembly:        2121701G01
Slot  1 Config Postcode:        00
Slot  1 Config Serialnum:       AA841905
Slot  1 Config Slavecode:       C1
Slot  1 Config Type:            N1
Slot  1 Daughter Assembly:      2121861G02
Slot  1 Daughter Serialnum:     AA841914
Slot  1 Paddle Assembly:        2121992G01
Slot  1 Paddle Serialnum:       315-03
Slot  1 Oem Assembly:
Slot  1 Oem Serialnum:
Slot  1 State:
        Top:     89 F (warning 165 F, shutdown 174 F)
                 31 C (warning  73 C, shutdown  78 C)
        Bottom:  93 F (warning 131 F, shutdown 174 F)
                 33 C (warning  55 C, shutdown  78 C)
Slot  1 Voltage:
        TCS VCC Voltage:        5.004 (Normal Range: 4.614 / 5.371)
        VCC Voltage:            5.004 (Normal Range: 4.370 / 5.615)
        SCSI Voltage:           4.785 (Normal Range: 4.614 / 5.371)
        VPP Voltage*:           0.000 (Normal Range: 11.067 / 12.858)
                *VPP Voltage Is Valid Only During FLASH Initialization

Slot 1 power: On
cli>
![]()
![]()
![]()
![]()
![]()
![]()
![]()
![]()