Table of Contents
Using the FDDI Status Utility
Using the FDDI Status Utility
This appendix describes the FDDI status utility, which is the workgroup monitoring tool for the EISA PC adapter. This utility works in conjunction with the workgroup drivers on DOS and OS/2 systems.
Running fddistat
The File Status utilities (fddistat) for DOS and Windows NT are supplied on the workgroup EISA PC Driver disk.
For DOS systems running the ODI driver, use the following path:
A:\novell\client\tools\fddistat.exe
For Microsoft Windows NT systems running the Windows NT driver, use the following path:
A:\winnt\i386\fddistat.exe
Copy the appropriate utility to your hard disk.
NetWare servers can view the FDDI statistics through the console monitor (monitor.nlm). Make sure the monitor.nlm file version is 2-4-93 or later.
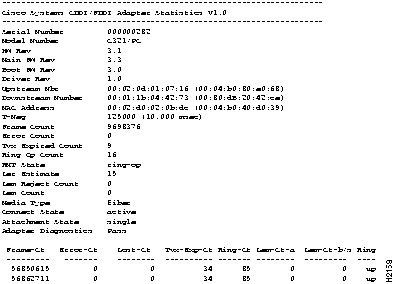
The format of the fddistat command follows, where -p perpetually displays the short form of information. The -p parameter provides continual updates to a basic set of data, which is useful for monitoring. This option will continue to display until you press any key. (For additional information see Figure B-2.)
fddistat [-p] [-h]
Note The -h option may slow down your system when displaying fddistat options.
Workgroup fddistat Statistics
The fddistat utility provides statistics for monitoring the workgroup EISA PC adapter.
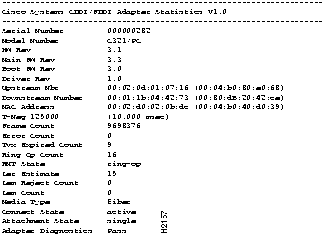
Figure B-1 shows an example of fddistat output for a single attachment configuration.

Figure B-1 : FFDI Single Attachment Configuration Output Example
The fddistat parameters are defined as follows:
- Serial Number---Displays the adapter serial number.
- Model Number---Displays the model number of the EISA PC adapter.
- Hardware Revision---Displays the hardware revision of the EISA PC adapter.
- Main Firmware Revision---Displays the revision of the main firmware residing in the adapter Flash memory.
- Boot Firmware Revision---Displays the revision of the boot firmware in the adapter.
- Driver Revision---Indicates the revision of the installed driver.
- Upstream Nbr---Displays the address of the MAC current upstream neighbor, defined as the previous MAC that sent frames to this MAC.
- Downstream Nbr---Displays the address of the MAC current downstream neighbor.
- MAC Address---Displays the adapter's MAC address.
- T-Neg---Displays the TReq value agreed upon by all MACs in the ring.
- Frame Count---Displays the number of frames that the MAC has seen on the ring.
- Error Count---Displays a count of all error frames detected by this MAC. Frames that were detected as bad by a previous station are not included in this count.
- TVX Expired Count---Displays the number of times that the TVX timer expired because of a problem on the ring.
- Ring OP Count---Shows the number of times that the ring goes up from an inoperable state.
- RMT State---Shows the ring management state. Ring management identifies stuck beaconing, initiates traces, provides notification of MAC availability, and detects duplicate addresses that prevent ring operation. This field will have one of the following values:
- Isolated---The initial state of the RMT.
- Non_Op---The ring is not operational.
- Ring_Op---The ring is operational.
- Detect---A duplicate address was detected and rendered the ring nonoperational.
- Non_Op_Dup---The ring is not operational because this MAC has a duplicate address.
- Ring _Op_Dup---This MAC has a duplicate address.
- Directed---This MAC sends beacon frames to notify the ring of a stuck condition.
- Trace---The MAC initiates a trace function. Trace provides a recovery mechanism from a stuck beacon.
- Ler Estimate---Link error rate estimate (LER) defines the long-term estimated error rate for the link. This value is the exponent of 10--x. For example, if the indicated value is 11, the estimated error rate is 10--11. Thus the higher the value of the Ler Estimate, the lower the link error rate. Values range from 10--4 to 10--15.
- Lem Reject Count---Displays the link error monitor rejected count (the number of times a link was disabled because the link error rate reached the cutoff threshold).
- Lem Count---Displays the link error monitor count or the number of recorded link errors received. This value is used to estimate the link error rate. The link error monitor helps measure link performance and isolate faulty links that pass initial tests.
- Media Type---Indicates the media type of the adapter:
- cddi---cddi MLT-2
- MLT-3---cddi MLT-3
- smfiber---Single-mode fiber
- fiber---Multimode fiber
- Connect State---Indicates the connect state of this port. It groups PCM states and PC-Withhold flag states. The connect states follow:
- Disabled---The port is disconnected.
- Connecting---The port is attempting to connect.
- Standby---The connection is withheld or is the inactive port of a dual-homing EISA PC adapter.
- Active---The port is active.
- Attachment Class---Indicates the attachment type of the adapter: single or dual.
- Adapter Diagnostics---Indicates whether or not the adapter passed diagnostics.
Using the Perpetual Form
The perpetual data form displays the basic information and continually updates selected data at the bottom until you press any key. Figure B-2 is an example of a perpetual data form.

Figure B-2 : Perpetual Data Form Screen Example
Copyright 1988-1996 © Cisco Systems Inc.


![]()
![]()
![]()
![]()
![]()
![]()
![]()
![]()